

So, what on earth is football analytics? At its core, it's the art of using data to understand the beautiful game on a much deeper level. It is about looking past the final score to figure out why a team won or lost and spotting the hidden patterns that decide a match.
Think of yourself as a detective at the side of the pitch. Instead of a magnifying glass, you're using clues (data) to solve the ultimate puzzle: how to win.
What Is Football Analytics Anyway?

Welcome to the new era of football, where hard numbers and clever tactics come together to tell the full story. Forget the old cliché of analysts getting lost in spreadsheets; modern analytics is a fascinating field that brings a dose of objectivity to the passion and gut feelings that have always driven the sport.
This data-driven approach does not replace the expert eye of a coach or scout—it enhances it. It offers concrete evidence to back up tactical hunches, guide player recruitment, and fine-tune drills on the training ground.
The Rise of Data in British Football
Here in the UK, football analytics has gone through a massive transformation. What was once a niche interest for stat-heads is now a central pillar of strategy in the Premier League and beyond. Since the early 2000s, companies like Opta and StatsBomb have completely changed the game, meticulously recording and analysing every pass, tackle, and shot.
This is not just a passing trend; it's a booming industry. The UK market for sports analytics was valued at a cool £52 million in 2023 and is expected to rocket to £340 million by 2030. That tells you everything you need to know about how seriously clubs are taking their data. If you're curious, you can discover further insights into UK football data to see just how big this has become.
This guide is your starting block for a journey into this exciting world. We will break down the basics of data and show you the real-world strategies that are reshaping modern football.
The goal of analytics is not to replace the eye test but to enhance it. It allows us to confirm what we see, challenge our biases, and discover insights that might otherwise be missed.
What You Will Learn
Think of this intro as your first training session. We will walk you from the fundamental concepts to the more advanced applications, making sure you build a solid foundation of knowledge. By the end, you'll be able to watch a match with a completely fresh perspective.
Here’s a quick peek at what we’ll cover:
- The Building Blocks: We’ll break down the two main types of football data.
- Key Metrics Explained: You’ll get to grips with essential stats like Expected Goals (xG).
- Real-World Application: See how top clubs are using data to get a leg up on the competition.
Ready to get stuck in? For a deeper look at the fundamentals, check out our guide on how to analyse football stats like a pro.
The Two Pillars of Football Data Collection
To really get your head around football analytics, you first need to understand where all the information comes from. Every single stat, chart, and tactical insight begins with raw data captured during a match. This data is collected in two main ways, and they form the bedrock of everything that follows.
Think of it like telling the story of a game. You need two key things: the script that details exactly what happens, and the stage map showing where everyone is at all times. In football, we call these event data and tracking data. Nailing the difference between these two is the first proper step on your analytics journey.
This infographic breaks down how these two data types are the core ingredients for all football analysis.
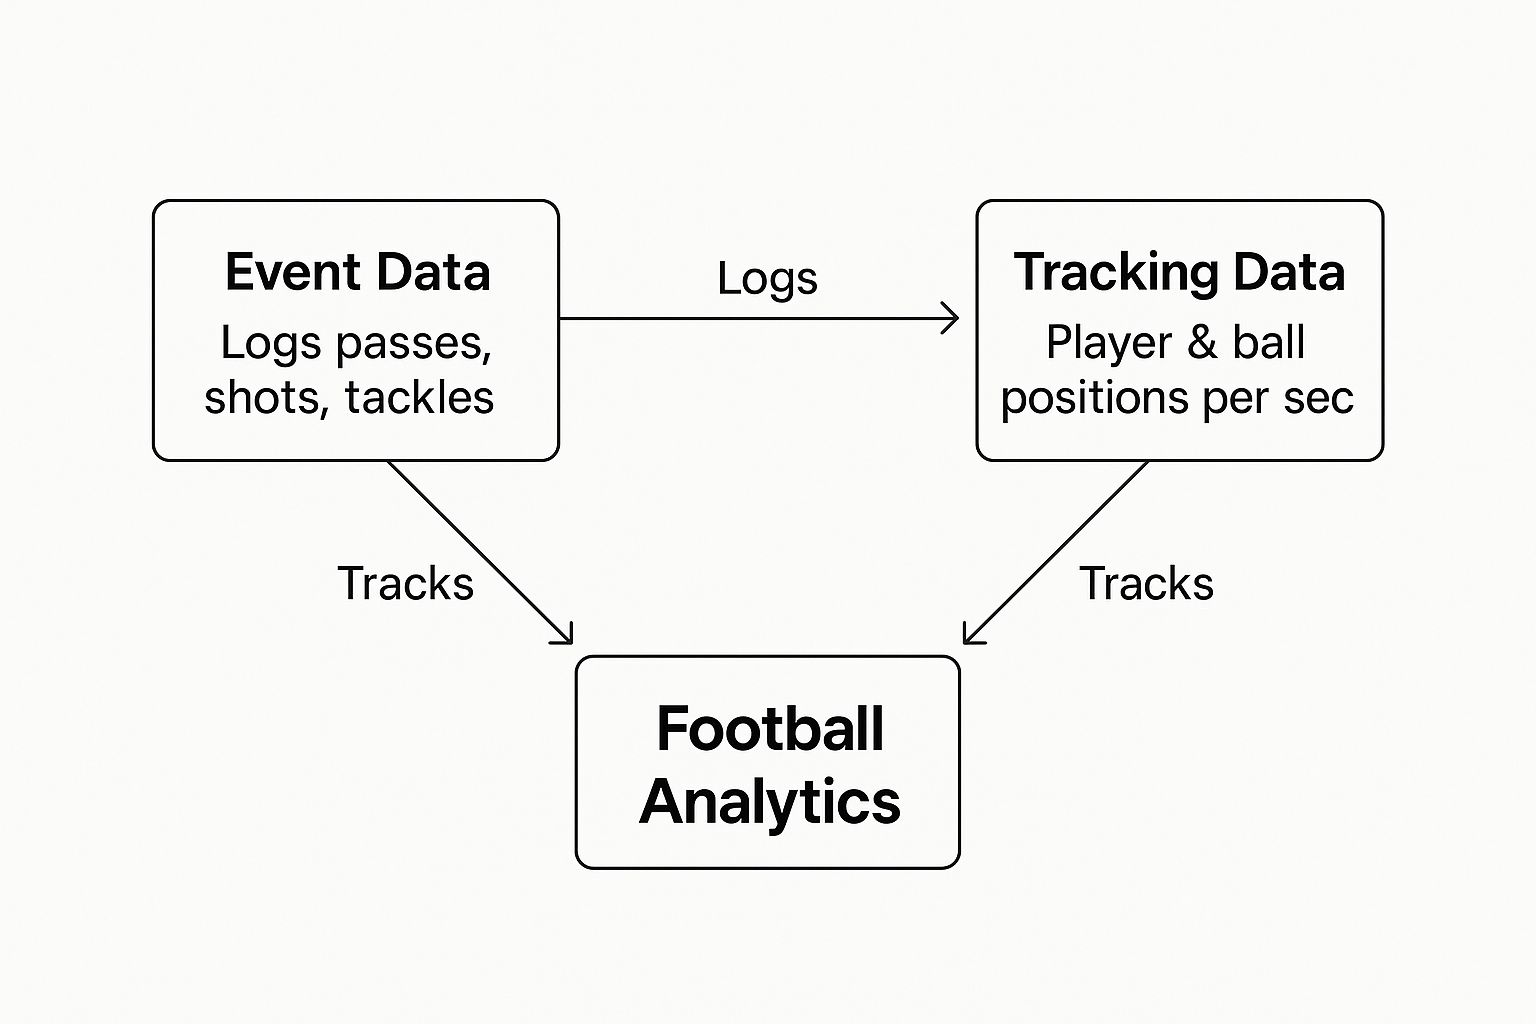
As you can see, both types feed into the analytics process, giving us two distinct but equally important views of the game.
Event Data: The 'What' of the Game
First up, we have event data. This is the most common and accessible type of data out there. As the name suggests, it logs significant on-the-ball events. Human analysts, usually helped by specialised software, watch matches and meticulously record every meaningful action.
This data is basically a detailed logbook of the match, answering the question, "What just happened?"
These actions include things like:
- A pass from Player A to Player B
- A shot taken by Player C
- A successful tackle made by Player D
- A cross delivered into the penalty area
- A foul committed or a card given
For decades, this was pretty much the only way football was analysed with numbers. It's relatively simple to collect and gives a neat, structured summary of key moments. This is where traditional stats like pass completion percentage and total shots come from.
Think of event data as the official match commentary script. It tells you exactly who did what and when, providing the step-by-step story of the game from kick-off to the final whistle.
But event data has its limits. While it tells us what happened, it does not give us the full context of why or how it happened. It completely misses all the crucial off-the-ball runs and player positioning that create the chances in the first place. And that’s where the second pillar comes in.
Tracking Data: The 'Where' of the Game
Enter tracking data, a much more recent and ridiculously detailed source of information. This type of data captures the precise X and Y coordinates of every player on the pitch—and the ball—multiple times every second. It is like having a GPS map of the entire game, charting every single movement.
This is all made possible by some seriously clever technology:
- Optical Tracking: Multiple high-tech cameras are dotted around the stadium, using computer vision to identify and follow each player and the ball.
- GPS/LPS Systems: Players wear small devices, usually in vests under their kits, that use GPS (Global Positioning System) or LPS (Local Positioning System) tech to send out their location data in real time.
This technology gives analysts an incredible amount of information, answering the question, "Where is everyone, and how are they moving?" With tracking data, you can analyse a team's shape, a player's acceleration, the spaces being created or closed down, and the physical effort of each individual. It captures the entire tactical dance of a match, not just the moments a player actually touches the ball.
If you want to learn more about this technology, you can explore the ins and outs of football GPS tracking and how it’s being used in modern training.
Event Data vs Tracking Data: A Quick Comparison
So, to quickly sum up the differences, let's put them side-by-side. Both are vital for a complete picture, but they tell very different parts of the story.
| Aspect | Event Data | Tracking Data |
|---|---|---|
| What It Captures | On-ball actions (passes, shots, tackles) | Positional coordinates of all players & the ball |
| Key Question | "What happened?" | "Where is everyone and how are they moving?" |
| Collection Method | Human operators logging events | Automated cameras or wearable sensors (GPS/LPS) |
| Main Use | Traditional performance stats (e.g., pass accuracy) | Tactical analysis, physical output, spatial control |
| Availability | Widely available and more common | More expensive and less common, especially at lower levels |
| Completeness | Only captures on-ball moments | Captures everything, including off-the-ball movement |
Understanding both is key. Event data gives you the highlights and key plot points, while tracking data provides the full, rich context that explains how those moments came to be. Together, they give analysts the power to see the game in a way that was impossible just a few years ago.
Understanding the Metrics That Matter Most

Okay, so we know where all the raw data comes from. Now for the fun part: turning those countless passes, tackles, and coordinates into something that actually tells a story about the game.
This is where advanced metrics come in. They offer a much richer picture than the traditional stats you see on a typical match summary. 'Shots on target' is fine, but it doesn't distinguish between a tap-in from six yards and a hopeful punt from the halfway line. Modern analytics adds that crucial layer of context.
At the heart of this new language is a concept you have probably heard of: Expected Goals, or xG. If you only learn one metric from this guide, make it this one. It is the cornerstone of modern football analysis.
Decoding Expected Goals (xG)
So, what on earth is xG? In short, Expected Goals (xG) measures the quality of a goalscoring chance. It gives every single shot a value between 0.00 and 1.00, which represents the probability of that shot ending up in the back of the net.
Think of it this way. A penalty is a golden opportunity. Historically, about 76% of penalties are scored, so a penalty kick gets an xG value of around 0.76. It is not a guaranteed goal, but it's a very, very good chance.
On the flip side, a speculative shot from 40 yards out with three defenders in the way is incredibly unlikely to go in. That chance might only have an xG of 0.01, meaning a player would score it just 1% of the time.
Expected Goals does not predict whether a specific shot will be a goal. Instead, it tells us how likely a goal is, based on thousands of similar shots from the past. It’s a measure of chance quality, not a crystal ball.
This magic number is calculated by analysing a massive database of historical shots, taking into account factors like:
- Shot Location: Is it from inside the six-yard box or 30 yards out?
- Angle to Goal: Is the player shooting from a central position or a tight angle?
- Body Part Used: Was it a powerful shot with their stronger foot or a header?
- Game Situation: Was it a one-on-one during a counter-attack or a crowded set-piece?
By adding up a team's total xG and comparing it to the goals they actually scored, we get a much clearer picture of their performance. A team that creates 3.0 xG but scores zero has probably been unlucky or incredibly wasteful. Conversely, a team that scores three goals from just 0.5 xG has likely been ridiculously clinical or just plain lucky.
Beyond xG: Other Essential Metrics
While xG gets all the headlines, it is part of a whole family of 'Expected' stats that paint a more complete picture. Getting to grips with these will really take your understanding to the next level.
Expected Assists (xA)
If xG is all about the quality of the shot, Expected Assists (xA) is about the quality of the pass before the shot. It measures the likelihood that a pass will become a goal assist. A simple five-yard pass to a striker who then dribbles past three defenders and scores will have a tiny xA. But a perfectly weighted through ball that puts the striker one-on-one with the keeper? That will have a very high xA. This helps us credit the creative players, even if the striker fluffs their lines.
Progressive Passes and Carries
These metrics are brilliant for spotting the players who actually move the team forward. A progressive pass is one that moves the ball a significant distance towards the opponent's goal, while a progressive carry is when a player runs with the ball a similar distance. It helps us see which midfielders and defenders are driving the team up the pitch, not just passing sideways.
Defensive Actions
Analytics is not just about attack. Metrics like tackles, interceptions, pressures, and blocks are vital for judging a player's defensive work. Modern data can even tell us where these actions happen and whether a pressure led to the team winning the ball back. It gives us a far more detailed view of a player's defensive work rate and intelligence.
Here’s a quick breakdown of how these new metrics tell a better story than the old ones:
| Traditional Stat | The Limitation | Advanced Metric | The Deeper Insight |
|---|---|---|---|
| Shots on Target | Treats all shots the same. | Expected Goals (xG) | Measures the actual quality of each chance. |
| Assists | Only counts if the goal is scored. | Expected Assists (xA) | Credits players for creating great chances, regardless of the finish. |
| Pass Completion % | Can be inflated by safe back-passes. | Progressive Passes | Highlights players who move the ball into dangerous areas. |
| Total Tackles | Misses other key defensive work. | Pressures & Interceptions | Gives a fuller picture of a player's defensive activity. |
By using these more sophisticated metrics, we can move beyond gut feelings and surface-level stats. We can more accurately judge whether a striker is getting into the right positions, if a midfielder is truly a creative force, or if a defender's contribution goes beyond just last-ditch tackles. This is the real power of football analytics in action.
How Premier League Clubs Use Data to Win

Understanding the metrics is one thing, but seeing them in action is where the real magic happens. This is where theory hits the turf. Football analytics is not just a fascinating academic exercise; it's a powerful tool that top Premier League clubs are using every single day to gain an edge, make smarter decisions, and ultimately, win more matches.
From uncovering hidden gems in the transfer market to fine-tuning on-pitch tactics, data has become a core part of modern football strategy. The most successful clubs have woven analytics right into the fabric of their operations, proving that numbers can lead directly to silverware.
Brentford: The 'Moneyball' Masterclass
Perhaps no club in recent memory demonstrates the power of smart data use better than Brentford FC. Their rise to the Premier League was not built on a huge budget but on a shrewd, data-first approach often compared to the 'Moneyball' story in baseball.
They deliberately look for undervalued players whose underlying performance metrics are excellent, even if their traditional stats or reputation do not stand out. By trusting their data models, they have consistently signed players like Ollie Watkins and Saïd Benrahma for modest fees, developed them, and then sold them on for huge profits.
This strategy is powered by:
- Identifying Market Inefficiencies: They use data to find players who excel in key areas (like creating high-quality chances or winning duels) that other clubs might overlook.
- Focus on Set-Pieces: Brentford are famous for their innovative and meticulously planned set-piece routines, all designed and tested using performance data.
- Recruitment Based on xG: They heavily weigh a striker's Expected Goals (xG) performance, believing it's a better predictor of future success than actual goals scored.
This calculated approach allowed them to compete with financial heavyweights and secure a stable place in the top flight, making them a textbook case study in football analytics for beginners.
Liverpool: Building a Title-Winning Machine
Liverpool's journey to Premier League and Champions League glory under Jürgen Klopp was heavily influenced by their world-class analytics department. Their recruitment strategy, in particular, was a masterclass in using data to find players who were a perfect fit for Klopp’s high-energy, gegenpressing system.
The club’s data team identified that their high-intensity style required players with exceptional physical output and the intelligence to press effectively. This led them to sign players who excelled in metrics related to pressures, ball recoveries in the final third, and progressive carries.
The impact of football analytics on UK clubs’ recruitment and match strategy has been huge. Leicester City's incredible 2015-16 title win saw analytics optimise fitness and reduce injuries. Liverpool’s data-driven recruitment was key in acquiring players like Mohamed Salah and Sadio Mané, correlating with multiple major titles. Manchester City uses possession-based stats to dominate, while Brentford has employed their 'Moneyball' approach. These examples show analytics as a key part of competitive football in the UK, a topic you can explore more deeply with this Premier League analysis.
"Data doesn't make the decisions, but it provides the information on which to make good decisions. It narrows down the options and challenges our biases."
This quote perfectly captures the philosophy. Analytics did not replace the football knowledge of Klopp and his staff; it empowered them with objective insights to build one of the most formidable teams in modern history. These stories prove that data is not just for spreadsheets—it's for winning trophies.
Your First Steps into Football Analytics
All the theory is great, but the only way to really learn football analytics is to get your hands dirty. The good news? You do not need a job at a Premier League club or a degree in data science to get started. Thanks to an explosion of free resources, anyone with a bit of curiosity can start exploring the numbers behind the beautiful game.
This section is your practical starting point. We will show you where to find the data, give you a simple first project to tackle, and point you towards the online community that can help you learn. Think of this as your first proper training session.
Finding Your Data Sources
Before you can analyse anything, you need good, reliable data. In the past, this was the biggest hurdle for aspiring analysts, but now there are incredible platforms offering huge datasets for free. These are the two you should bookmark right away.
-
FBref: This is the one to start with. Powered by Stats Perform, it is probably the most comprehensive free football stats website out there. It is incredibly easy to use and perfect for beginners, covering everything from basic goals and assists to advanced metrics like xG and progressive passes for hundreds of leagues.
-
StatsBomb: A massive name in the industry, StatsBomb generously provides free open data, which includes detailed event data for major competitions. This is a bit more advanced and often requires some coding knowledge (like Python or R) to really dig into, but it’s an amazing resource for when you’re ready to take the next step.
For now, stick with FBref. Its clean layout makes it easy to browse and compare stats without feeling overwhelmed. It is the perfect place to get comfortable with all the metrics we’ve talked about.
Your First Analytics Project
The best way to learn is by doing. So, let’s pick a simple question you're genuinely curious about and use the data to find an answer. This makes the whole process much more engaging and helps the concepts stick.
Here’s an easy one to get you going: "Who is my club's most effective striker?"
- Head over to FBref: Find your favourite team's page.
- Look for the 'Shooting' Stats: You'll see a table with all the squad's shooting statistics.
- Compare the Strikers: Now the fun part. Do not just look at who has the most goals. Compare their xG (the quality of their chances), their npxG (non-penalty xG), and their shots on target percentage.
- Draw a Conclusion: Is the top goalscorer also the one getting the best chances (highest xG)? Or is another striker underperforming their xG, which might suggest they've been unlucky and are due a goal soon?
This simple exercise instantly shifts you from being a passive fan to an active analyst. You're no longer just stating opinions; you're backing them up with evidence.
Your first project doesn’t need to be groundbreaking. The goal is to get comfortable navigating the data, understanding what the metrics mean in a real-world context, and telling a simple story with the numbers.
If you are a coach or a player, you can apply these same principles to your own game. Using wearable tech is a brilliant way to collect your own performance data. A great starting point is learning how to read football GPS data, which will help you analyse your own physical output and on-pitch movements.
Immerse Yourself in the Community
You do not have to learn this stuff in a vacuum. The football analytics community is vibrant, welcoming, and full of brilliant people sharing their work and helping each other out. Following key analysts and websites is a fantastic way to speed up your learning curve.
Here are a few to get you started:
- StatsBomb and Opta: Follow their official blogs and social media accounts for professional-level insights.
- The Athletic: Often publishes deep-dive analytical articles from some of the best writers in the business.
- Key Analysts on X (formerly Twitter): Following people like Michael Caley, Grace Robertson, and Mark Stats will fill your feed with charts, fresh ideas, and interesting discussions.
By surrounding yourself with these resources, you'll naturally pick up new concepts, discover clever ways to visualise data, and stay on top of the latest trends in football analytics.
The Future of Football Is Data-Driven
If our journey through football analytics has taught us anything, it’s that data is here to stay. This is not about replacing the gut instinct of a manager who's seen it all or the raw passion you feel watching from the stands. Instead, it’s about adding another layer—a powerful new lens to see the game with, revealing objective truths that were once invisible.
You now have the fundamentals to look at football differently. From understanding how event and tracking data are gathered to seeing the story that a metric like Expected Goals (xG) can tell, you’re ready to look beyond the final score. And as Brentford’s smart recruitment has shown us, this is not just theory. It’s a proven way to get ahead.
The Next Frontier: AI and Machine Learning
The evolution of football analytics is far from over. In fact, the next wave is already here, driven by Artificial Intelligence (AI) and machine learning. These technologies are starting to crunch complex tracking data to do incredible things, like identifying optimal player positioning, predicting what an opponent might do next, and even scouting the next generation of talent with startling accuracy.
Football analytics isn’t about finding a single 'correct' way to play. It's about asking better questions and using data to explore every possible answer, pushing the boundaries of what’s possible on the pitch.
This guide has given you the tools to start that journey. The beautiful game has an exciting, data-rich dimension waiting to be discovered, and now you know exactly where to begin.
Your Questions Answered
Alright, let's tackle some of the questions that always come up when people first dip their toes into the world of football analytics. Think of this as a quick-fire round to clear up any lingering doubts.
Do I Need a PhD in Maths to Understand This Stuff?
Absolutely not. It is a common misconception that you need to be a data scientist to get anything out of analytics. For most fans, coaches, and even players, it is not about building the complex models yourself.
It is about understanding what the numbers are telling you. Think of it this way: you do not need to be a mechanic to know what the fuel gauge in your car means.
Learning a key metric like Expected Goals (xG) is the perfect starting point. It is like learning the offside rule – once you get it, you see the game in a whole new light. Free tools like FBref have made this accessible to everyone, no coding required.
Is Analytics Sucking the Fun Out of Football?
This is the big one, is it not? The fear that spreadsheets are replacing the magic of a last-minute screamer. But honestly, that’s not how it works in practice.
Analytics does not kill the joy; it adds a new layer of appreciation. It helps you see the tactical chess match unfolding on the pitch that leads to those incredible, spontaneous moments. It gives you the "why" behind a team's dominance or a sudden collapse.
Data provides context. It enhances the story of the game, it does not erase it.
If I Only Learn One Metric, What Should It Be?
Easy. Expected Goals (xG).
If you take away just one thing from all this, make it xG. It is the absolute bedrock of modern football analysis and the key that unlocks almost everything else.
It tells you about the quality of chances a team is creating and giving up, which is a far better indicator of performance than just the final score. A team that keeps creating high-xG chances is doing something right, even if the ball is not hitting the back of the net. Master this, and you're officially in the conversation.
Where Can I Find Good Football Data for Free?
You're in luck. There are some fantastic free resources out there that the pros use every day. These are your go-to starting points:
- FBref: This should be your first stop. It is a goldmine of stats for pretty much every player, team, and league you can think of, presented in a really clear way.
- StatsBomb: For when you're ready to go a bit deeper. They generously release massive, detailed datasets from major tournaments for free, which is incredible for anyone wanting to play with raw data.
A great tip is to also follow top analysts on X (formerly Twitter). You’ll see how they use data to tell stories and find insights you might have missed.
At SoccerWares, we’re all about helping you understand the game on a deeper level. Whether it's through cutting-edge training gear or showing your team pride, we have got your back. Check out our full collection at https://soccerwares.com.