
You have a mountain of numbers from your GPS tracker: total distance, max speed, sprint distance. It all looks impressive, but what does it actually mean for your game? The real skill is learning to translate those raw figures into actionable insights about what’s happening on the pitch. Once you get the hang of it, you can analyse your performance, manage your workload, and make smarter decisions about your training.
Decoding the Numbers on Your GPS Tracker
Before you can start picking apart your performance, you need to understand what the core numbers represent in a real football match. Forget the textbook definitions for a moment. We’re talking about turning abstract stats into tangible, on-pitch scenarios. This is the foundation for turning a spreadsheet of data into genuine insights that can shape everything from your recovery to your tactical awareness.
It's no secret that GPS data has become a massive part of the game in UK football clubs, from non-league grounds right up to the Premier League. As performance coach Ben Nicholson puts it, these trackers provide an objective, detailed look at a player's physical output. They record the basics like total distance covered, top speeds, sprint counts, and high-speed running distances. For a deeper dive into the tech itself, you can check out our detailed guide on how football GPS tracking works.
Understanding the Core Metrics
Let's break down the most common data points and what they're really telling you about your performance.
-
Total Distance: This is the headline figure—the overall ground you covered. A high number is exactly what you'd expect from a box-to-box midfielder, but it might be a red flag for a centre-back. If their distance is sky-high, are they being dragged out of position too often?
-
Max Speed: This is your single fastest burst. For a winger, hitting a high max speed shows they’re a genuine threat on the break. For a defender, it might highlight a crucial, lung-busting recovery sprint that saved a certain goal.
-
Sprint Distance: This adds up all the ground you covered while running at or near your top gear. It’s a brilliant measure of your high-intensity work rate. A striker with a high sprint distance is probably making clever, repeated runs in behind, whereas a full-back is getting up and down the wing all game.
-
Player Load: This is a much smarter metric than just distance. It measures your total workload by factoring in every single acceleration, deceleration, and change of direction. It gives a far more accurate picture of the physical stress you’re under.
A short, sharp training session packed with quick turns and sprints can rack up a much higher Player Load than a long, steady jog. That makes it an absolutely vital number for managing fatigue and avoiding burnout.
When you start looking at these numbers together, they begin to paint a picture of your contribution to the team. Learning to read them in the context of your position and the match situation is the first real step toward using data to become a better, more intelligent footballer.
Essential Football GPS Metrics Explained
To make things even clearer, here’s a quick-reference table breaking down the most common GPS metrics you'll come across. Think of it as your cheat sheet for understanding what the data is telling you.
| Metric | What It Measures | Why It Matters for Footballers |
|---|---|---|
| Total Distance | The entire distance covered during a session or match, measured in kilometres or miles. | Indicates overall stamina and work rate. Essential for midfielders, but can highlight positional issues for others. |
| Max Speed | The single highest speed achieved, typically measured in km/h or mph. | Shows explosive potential. Crucial for attackers on breakaways and defenders making recovery runs. |
| Sprint Distance | The total distance covered while running above a set high-speed threshold (e.g., >20 km/h). | A key indicator of high-intensity effort and willingness to make game-changing runs. |
| Number of Sprints | The total count of individual high-speed running efforts. | Measures repeat sprint ability. High numbers show a player is consistently pushing the opposition's defensive line. |
| Player Load | A comprehensive measure of mechanical stress on the body from all movements. | The best metric for managing overall workload, fatigue, and injury risk. Far more telling than distance alone. |
| Accelerations | The number of times a player rapidly increases their speed. | Highlights a player's ability to be dynamic and explosive. Key for beating a marker from a standing start. |
Each of these metrics tells a small part of a bigger story. The real magic happens when you start connecting the dots between them. For instance, a player with a low total distance but a high number of sprints and accelerations is likely playing an explosive, impactful role without wasting energy—think of a classic poacher in the box.
From Syncing to Visualising Your Data
Collecting the numbers is just the first step. The real analysis begins when you sync your device and bring that raw data to life, turning a mess of figures into something you can actually use to understand what happened on the pitch.
Most modern GPS trackers make this incredibly simple. After a session, you’ll sync your pod with a mobile app—like the one that comes with the STATSports Apex Athlete Series. This instantly beams all your recorded metrics, from distance covered to your top sprint speed, onto a central dashboard. Think of it as your personal mission control, where every part of your performance is laid out and ready for a proper deep dive.
Turning Numbers Into Pictures
The dashboard is where you stop looking at lists and start using powerful visual tools. For me, two of the most insightful features are heatmaps and sprint charts. These are critical for learning how to read football GPS data because they don’t just tell you what you did, but where and when you did it.
A heatmap gives you a bird's-eye view of the pitch, showing exactly where you spent most of your time. Bright, concentrated "hot" spots reveal your main areas of operation. If you’re a winger, you’d expect to see a fiery line all the way up and down the touchline. A defensive midfielder? Their heatmap should be glowing right in the centre of the park.
By looking at your heatmap, you can see in seconds if you're holding your position or getting dragged into parts of the pitch where you're less effective. It’s an honest, visual check on your tactical discipline.
Analysing Your Efforts Over Time
While heatmaps show where you were working, sprint graphs show when you were working hardest. These charts plot your sprint speeds and accelerations over the entire 90-minute timeline of a match. This is huge for seeing if your explosive efforts stayed consistent or if they tailed off as you got tired.
Here's a simple way to think about how the core metrics build a complete picture of your performance.
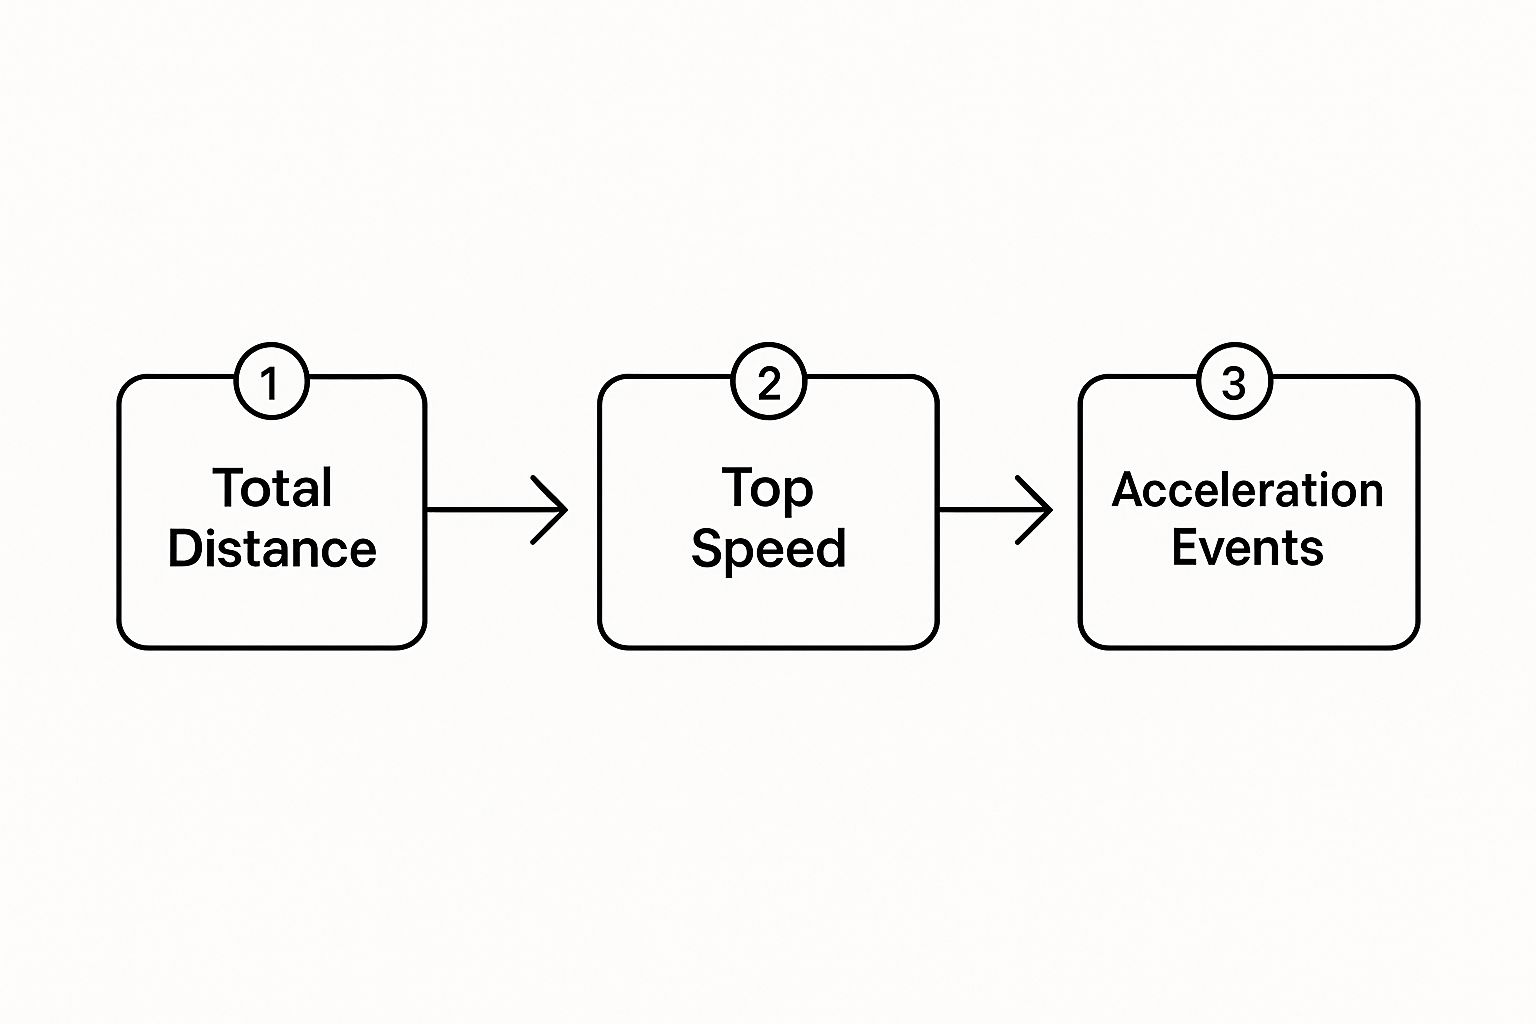
As the graphic shows, total distance gives you a baseline of your work rate, top speed shows your peak physical output, and your acceleration numbers reveal just how dynamic you were.
The real key, though, is comparing your data against yourself. Are your sprint numbers higher this month than last? Is your heatmap showing you getting into more attacking areas? This is where raw data starts to fuel genuine development. For a closer look at the tech behind it all, check out our guide on the essentials of soccer GPS tracking.
Connecting GPS Data to Tactical Performance
Understanding your individual stats is one thing, but the real magic happens when you connect those numbers to what’s actually happening on the pitch. This is where you graduate from simply tracking fitness to conducting proper tactical analysis. It’s about using data to either confirm what your eyes are telling you or to spot something you might have missed entirely.
Suddenly, raw numbers start telling a story.
Metrics like High-Speed Running and your number of Accelerations/Decelerations are perfect examples. They do far more than just measure your work rate; they reveal your impact in the moments that matter. A high number of accelerations isn't just a sign of fitness—it could show you're a monster in the press or that you’re consistently making clever runs behind the defence. For a deeper dive into this, our guide on how to analyse football stats like a pro is a great next step.
Reading Your Heatmap for Positional Discipline
A heatmap is one of the most powerful—and brutally honest—visual tools you'll get. It gives you an unbiased look at your positioning and discipline over a full 90 minutes. In an instant, you can see if you stuck to your role or ended up drifting into areas where you had less impact.
Think about it from your position:
- For a fullback: Is your heatmap a solid, vibrant strip right down the touchline, showing you provided constant width? Or are there noticeable gaps where you got sucked into the middle?
- For a defensive midfielder: Is the centre of the park glowing red hot, proving you dominated the engine room? Or does it show you were dragged out wide too often, leaving your back four exposed?
- For a striker: Does your heatmap show you were a nightmare for defenders in and around the box? Or are you having to drop way too deep just to get a touch of the ball?
Your heatmap doesn't lie. It's a quick, visual audit of whether you actually did what the gaffer asked. A quick glance can confirm you were in the right places at the right times or highlight a positional habit you need to fix on the training ground.
This screenshot shows exactly how a device dashboard lays out these crucial performance metrics.
Here, you can see things like max speed, sprint count, and total distance all in one place, letting a player quickly size up their physical output against their tactical duties.
Linking Work Rate to Game Impact
Knowing how many sprints or accelerations you made is only half the story. The next level is to overlay this data with key moments from the match. Did your highest number of sprints happen when you were pressing the opposition's backline, leading to a turnover? Did that one powerful acceleration allow you to ghost past a defender and set up a chance?
This is where the pros really get their edge. In the UK, clubs are all over tech like the STATSports Arsenal FC Edition, a specialised tracker that measures 16 key performance metrics, including detailed heat maps and sprint breakdowns. It gives academy players a direct line of sight to what it takes to perform at a first-team level. This kind of precise data is now essential for scouting talent and designing training sessions that reflect the real demands of a match.
By cross-referencing your GPS data with match footage, abstract numbers suddenly become a powerful performance review tool. This is how players and coaches make smarter, data-backed decisions to get ahead of the competition.
Using Data to Manage Workload and Prevent Injury
This is arguably the most important reason for getting to grips with your GPS data: keeping yourself on the pitch. It’s all about playing smarter, not just harder. By actively tracking your physical output, you can stay in peak condition, cut down your risk of those frustrating non-contact injuries, and make sure you’re sharp for match day.
The secret here is understanding your workload over time. Think of metrics like Player Load as your personal early-warning system. Instead of waiting until you feel that heavy-legged fatigue, you can spot the warning signs in your data long before they become a real problem.
Identifying Overtraining and Undertraining
Consistency is everything in football. Your body gets used to a certain level of physical stress, but it’s the sudden changes that cause trouble. Your first goal should be to track your data over several weeks to get a clear baseline for your typical match and training loads.
Once you have that baseline, you can start spotting trends that scream "danger":
- A sudden spike in weekly workload: Did you have three tough training sessions and a cup match crammed into one week? A sharp increase in your Total Distance or Player Load compared to your average leaves you vulnerable.
- A big drop in performance metrics: If your total distance is high but your Max Speed and Sprint Distance are way down, it’s a classic sign that your body is struggling to recover. That’s accumulated fatigue talking.
- Undertraining before a big game: On the flip side, if your workload drops too much in the week leading up to a match, you might feel sluggish and off the pace. The data helps you find that sweet spot between rest and readiness.
Monitoring these trends is your best defence against burnout. A simple rule of thumb is to avoid weekly increases in training load of more than 10-15%. Anything more dramatic significantly ramps up your risk of picking up a soft-tissue injury.
Using Data for Smarter Recovery
This proactive approach is essential in the UK football scene, especially during those congested fixture periods. When English Football League (EFL) cup ties get added to the schedule, teams often face multiple matches in a very short window. This is where GPS data becomes vital for measuring exactly what players are doing, ensuring their workload is managed properly. To stay match-fit, players often need to cover around 5-6 kilometres in a standard training session—a benchmark that helps coaches balance intensity with recovery.
You can find more brilliant insights into how top teams manage player fitness over at sportsperformancetracking.com.
By truly understanding what you’ve put your body through, you can make much smarter decisions about what comes next. If your Player Load was through the roof after a weekend match, you know the next couple of days should be all about active recovery—light sessions, stretching, and proper nutrition—not more high-intensity drills.
It creates a simple but powerful feedback loop. The data from your last session directly informs your plan for the next one, building a sustainable cycle of performance and recovery. This makes sure you're not just fit, but match-fit when it really counts.
Benchmarking Your Performance and Setting Goals
So, you've got all this raw GPS data. It looks cool, but what does it actually mean? Numbers without context are just trivia. The real magic happens when you start benchmarking—pitting your stats against meaningful standards to see where you truly stand.
This is how you turn a page of numbers into a genuine roadmap for improvement.
The first and most important benchmark is always you. Comparing your match day data against your training sessions is a fundamental first step. Are you hitting the same max speeds and covering the same sprint distances in training as you do in a competitive game?
If there’s a big drop-off, it’s a red flag. It probably means your training intensity isn’t high enough to replicate the physical demands of a real match. This kind of comparison helps you make sure you’re physically prepared for the full 90 minutes, so you don't run out of steam in the crucial final 15 minutes.
Finding Your Context
Once you’ve got a handle on your own performance, it's time to look outwards. Comparing your data to others gives you a massive perspective boost and helps you understand where you fit in. It shines a light on your standout strengths and, more importantly, the areas where you need to put in some extra graft on the training ground.
Think about comparing your stats against these groups:
- Teammates: How do your metrics stack up against others in your position? If another winger is covering way more sprint distance, that’s a tangible target to aim for right there.
- Age-Group Averages: Many GPS platforms provide anonymised data for different age groups. This gives you a realistic benchmark for your level of football. It stops you from comparing your Sunday League numbers to a professional's.
- Professional Players: Some apps, like those from STATSports, let you compare your session data against the pros. Seeing how your work rate stacks up against a Premier League midfielder can be an incredible motivator.
Benchmarking isn't about judging yourself—it’s about understanding your performance. Seeing that your high-speed running is 10% below the average for your position isn't a failure. It's a specific, actionable area for you to focus on.
Setting Smarter, Data-Driven Goals
With all this context, you can finally move away from vague targets and set precise, measurable goals. This is the last piece of the puzzle, turning your data into genuine progress. Let’s be honest, ambitions like "I want to get fitter" are impossible to track and super easy to give up on.
Instead, use your benchmarked data to create specific, data-driven objectives.
From Vague to Specific
| Vague Goal | Data-Driven Goal |
|---|---|
| "Get faster" | "Increase my max speed by 0.5 m/s over the next six weeks." |
| "Improve my work rate" | "Increase my number of high-intensity runs per match by 15%." |
| "Be more involved" | "Cover more ground in the attacking third, as shown on my heatmap." |
This approach makes your development trackable and keeps you motivated. By setting a clear target—like upping your high-intensity runs—you know exactly what to focus on in training. The data then becomes your accountability partner, showing you week by week whether you're on track to smash your goal.
Got Questions About Football GPS Data?
Diving into the world of GPS data can feel a bit like learning a new language. At first, it's all numbers and charts, and it’s completely normal to have questions.
Getting clear answers is the key to unlocking its potential. Below, we've tackled some of the most common queries we hear from players and coaches, breaking them down into simple, straightforward advice.
How Accurate Is This Stuff, Really?
Modern football GPS trackers are incredibly accurate for outdoor use. The top-tier devices don't just rely on GPS; they combine it with other satellite systems and internal sensors, like accelerometers, to give you a really precise picture of your distance, speed, and movement.
While a dodgy satellite signal in a half-covered stadium could affect it slightly, for performance analysis, the data is overwhelmingly reliable. The trackers used by professional clubs are scientifically validated to be accurate within a tiny margin of error, which is why they're now a staple in elite sports science.
What Exactly Is 'Player Load'?
If there's one metric to rule them all, it's Player Load. Think of it as a single, powerful number that represents the total physical stress on your body during a session. It’s calculated using data from an accelerometer, which measures every single movement you make—every sprint, stop, jump, and change of direction.
This makes it a far better measure of effort than just looking at Total Distance. For instance, a short, sharp session packed with explosive sprints and turns can generate a much higher Player Load than a long, steady jog. This is why it’s the most important metric for managing fatigue and preventing burnout.
By tracking Player Load over time, you can spot dangerous spikes in your workload before they lead to injury. It’s the ultimate metric for understanding the true intensity of your efforts on the pitch.
Can I Use a GPS Tracker Indoors?
This is a common question. Standard GPS needs a clear line of sight to satellites in the sky, which obviously gets blocked when you head indoors. This means core metrics like your total distance, max speed, and heatmap won't be accurate for indoor football or futsal.
However, many modern trackers come with built-in accelerometers. These sensors don't need satellites and can still measure non-GPS metrics like Player Load and overall intensity. So, you'll still get some useful data from an indoor session, just not the full picture. For the most accurate data, stick to using it outdoors.
How Can I Compare My Data to a Pro?
This is where it gets really motivating. Many GPS tracker apps, like the one from STATSports, have built-in features that let you compare your stats against professional athletes. The app will often provide benchmarks for key metrics based on your position.
This gives your numbers real context. You can see how your physical output in a match stacks up against an elite player in the exact same role. It’s a brilliant way to understand where you are and set ambitious but realistic goals for your own performance.
Ready to take control of your performance with data-driven insights? At SoccerWares, we offer a curated selection of the latest football GPS trackers and essential training gear to help you reach your full potential. Explore our collection and start your journey to playing smarter today at https://soccerwares.com.